Few days back, customer escalated an issue which was going on for last 2 months and there was no progress.
Problem
Once or twice a month, memory consumption on a sever would hit 100%. To recover from the situation, we had to reboot the server from Azure console. I started by studying the incidents customer has raised. The server was hosting a critical application with both application and Sql databased on the same server. So when the issue was reported, ticket would bounce between Windows OS team and Sql database team. In all this, teams would lose the opportunity to do any specific analysis and in the limited time all they could confirm was that they did not observer a single process that was showing large memory consumption
Solution
To make sure we have ample time to do analysis, I asked Database team to configure sql agent job that will monitor the memory usage and will send out email alert when Memory Utilizations exceeds 85% for more than 10 minutes
Once I have the monitoring in place I was very confident that the issue is due to number of processes taking moderate amount of memory leading to this situation. With everything figured out, I waited for the issue to re-occur. Exactly after 3 days I got alert email in my inbox showing memory consumption exceeded 85%. Immediately, call was setup with windows OS and sql server team.
And this is what I saw first thing on the server, physical Memory at 95%
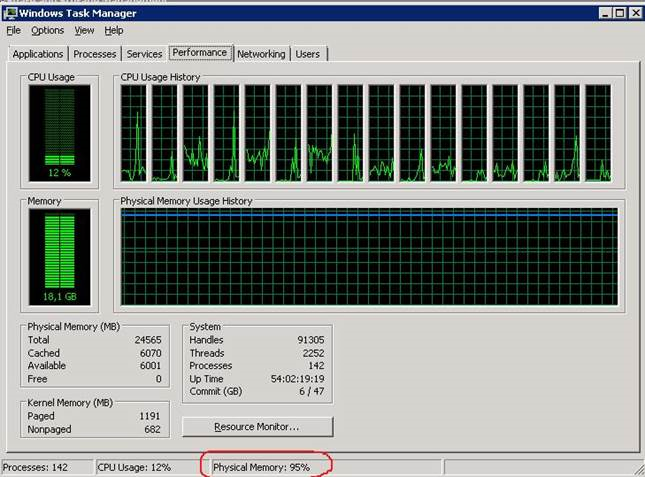
And to my utter shock, In the Processes tab, there is no process with abnormally high memory consumption. Moreover, when I added the approximate values of memory used by all processes the sum was not even 50% of physical memory. What is eating the memory then?
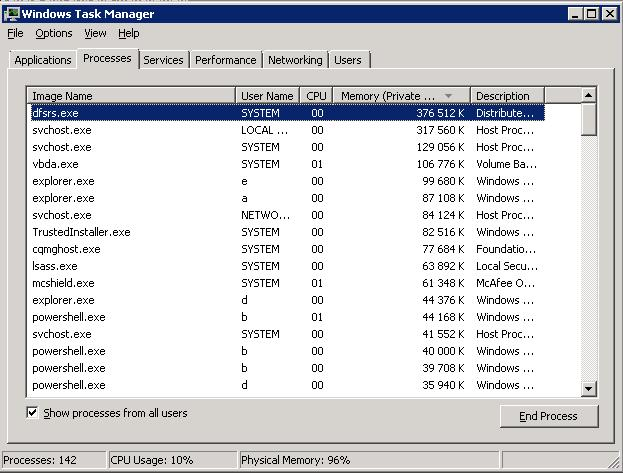
As usual by the time we figured all this out Physical memory usage reached 99% and we had to reboot the server to bring back services online.
we needed a tool that can look deep into the physical memory usage and help me figure what was eating RAM on this server. As usual I turned to sysinternal tools for help and saw a RAMMP.exe sitting in the folder. I went through the documentation and realized this is the tool that I am looking for. At the same time, I received email from user that they are going to run payroll next week and need this server in top condition and cannot afford any downtime.
As a precautionary measure I decided to reboot the server before payroll and then wait for the issue to re-occur. Fortunately, after the preemptive reboot, payroll cycle went fine but pressure was increasing.
I also started going through the documentation on RAMMap and all the different tabs and columns. Next 2 days went fine and then on the 3rd day late in night I received alert email in my box. I immediately called my Windows admin and asked him to run RAMMAP.exe on the server when memory utilization hits 95% .As soon as we executed the exe following window opened and the results really surprised me
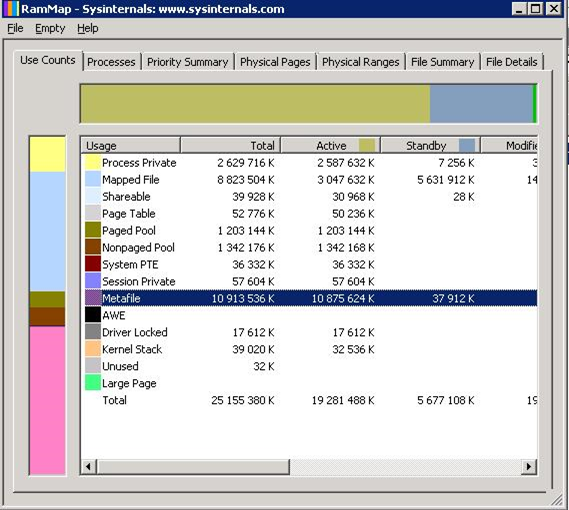
Metafile was consuming close to 11GB of memory and all of it was under active column.
What is Metafile?
A metafile is a part of the system cache containing NTFS metadata and used to increase the performance of the file system when accessing files. NTFS metadata include the data of MFT (Master File Table). For each file or folder, accessed by the users, a corresponding block of at least 1 KB (the record of an attribute of each file is 1 KB, and each file has at least one attribute) is created in the metafile. Thus, on file servers with a large number of files, the metafile size (NTFS cache) may exceed several tens of gigabytes.
How to Quickly Clean Up metafile?
RAMMap allows to quickly clear the used memory from MFT garbage without server restart. To do it, select Empty -> Empty System Working Set in the menu.
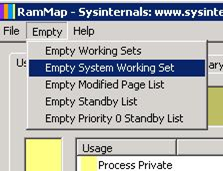
After this the percentage of RAM use by CPU dropped to 26%.
What caused this issue?
This issue occurs because of dynamic caching of 64 bit Windows server 2003, 2003 R2, 2008, and 2008 R2.
Memory management in Microsoft Windows operating systems uses a demand-based algorithm. If any process requests for and uses a large amount of memory, the size of the working set (the number of memory pages in the physical RAM) of the process increases. If these requests are continuous and unchecked, the working set of the process will grow to consume the entire physical RAM.
Automation
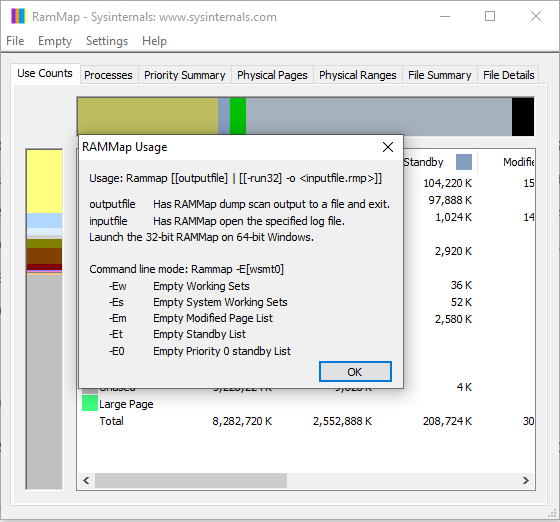
Next step was to automate this whole process of clearing System working set. To find out the commands , just to click on Help →Usage and all the command line parameters were right there.
References
- MS documentation

Thanks for including the command line arguments.