In this post we will take a closer look at Windows Process. We will start with defining different parts of a process, look briefly into Virtual Address space and then will take a closer look into internal data structure and threads.
A process is a container inside which a program executes. At a very high level, we can say Windows process consists of following :
1. Virtual Address Space :is a set of virtual memory addresses that the process can use and sort of s defines the boundary of the process. This allows independent execution of program without an interference from other programs
2. Threads: every process consists of at least 1 thread inside which the code executes.
3. Exe and DLLs which defines initial code and data that is mapped to virtual address space
4. A list of open handles to various system resources, such as semaphores, communication ports, and files
5. Security tokens
WinDbg Process Commands
Before we start lets take a quick look at process related windbg commands
!process — Display current process
!process 0 0 — In brief mode
!process 0 7 — In full mode
Lets see a example of above commands :
!process 0 0
PROCESS ffffc28869e82080
SessionId: 1 Cid: 0de8 Peb: 00c96000 ParentCid: 01dc
DirBase: 2f900002 ObjectTable: ffff800dd0e514c0 HandleCount: 1425.
Image: explorer.exe
PROCESS ffffc2886a218080
SessionId: 1 Cid: 0fe0 Peb: 1215701000 ParentCid: 0450
DirBase: 23500002 ObjectTable: ffff800dd0e51d00 HandleCount: 584.
Image: Taskmgr.exe
As you can see !process 0 0 will list all processes with brief information of Image name, DirBase address , objecttable and Handlecount
!process 0 7 will list all processes and will dump all the thread information with stack along with it.
Next we will do a small experiment with Memory addresses :
And then take a user mode address and dump values in that memory address
.process /r/p ffffc2886a218080
kd> dc 1215701000
00000012`15701000 04000000 00000000 ffffffff ffffffff ................
00000012`15701010 5e490000 00007ff7 10ba53c0 00007ffc ..I^.....S......
00000012`15701020 ceee1b60 0000017f 00000000 00000000 `...............
00000012`15701030 ceee0000 0000017f 10ba4fc0 00007ffc .........O......
00000012`15701040 00000000 00000000 00000000 00000000 ................
00000012`15701050 00000000 00000000 100d8070 00007ffc ........p.......
00000012`15701060 00000000 00000000 ced80000 0000017f ................
Next we will switch to a different process and then dump the values at the same memory address
kd> .process /r/p ffffc28869e82080
Implicit process is now ffffc288`69e82080
.cache forcedecodeuser done
kd> dc 1215701000
00000012`15701000 ???????? ???????? ???????? ???????? ????????????????
00000012`15701010 ???????? ???????? ???????? ???????? ????????????????
00000012`15701020 ???????? ???????? ???????? ???????? ????????????????
00000012`15701030 ???????? ???????? ???????? ???????? ????????????????
00000012`15701040 ???????? ???????? ???????? ???????? ????????????????
00000012`15701050 ???????? ???????? ???????? ???????? ????????????????
00000012`15701060 ???????? ???????? ???????? ???????? ????????????????
00000012`15701070 ???????? ???????? ???????? ???????? ????????????????
From above it is clear that same address within different address spaces contains different values. We can also conclude that if we change the value inside the address of one process it will not impact another process.
Process Data structures
Each Windows process is represented by an executive process (EPROCESS) structure. Besides containing many attributes relating to a process, an EPROCESS contains and points to a number of other related data structures. For example, each process has one or more threads, each represented by an executive thread (ETHREAD) structure.
The EPROCESS and most of its related data structures exist in system address space. One exception is the process environment block (PEB), which exists in the process address space (because it contains information accessed by user-mode code). Additionally, some of the process data structures used in memory management, such as the working set list, are valid only within the context of the current process, because they are stored in process-specific system space.
FORMAT OF AN EPROCESS STRUCTURE
We can use dt _eprocess to dump complete eprocess structure. Below is a small subset of all the fields
kd> dt _eprocess
nt!_EPROCESS
+0x000 Pcb : _KPROCESS
+0x2d8 ProcessLock : _EX_PUSH_LOCK
+0x2e0 UniqueProcessId : Ptr64 Void
+0x2e8 ActiveProcessLinks : _LIST_ENTRY
+0x2f8 RundownProtect : _EX_RUNDOWN_REF
+0x300 Flags2 : Uint4B
+0x300 JobNotReallyActive : Pos 0, 1 Bit
+0x300 AccountingFolded : Pos 1, 1 Bit
+0x300 NewProcessReported : Pos 2, 1 Bit
+0x300 ExitProcessReported : Pos 3, 1 Bit
+0x300 ReportCommitChanges : Pos 4, 1 Bit
+0x300 LastReportMemory : Pos 5, 1 Bit
+0x300 ForceWakeCharge : Pos 6, 1 Bit
+0x300 CrossSessionCreate : Pos 7, 1 Bit
+0x300 NeedsHandleRundown : Pos 8, 1 Bit
+0x300 RefTraceEnabled : Pos 9, 1 Bit
+0x300 PicoCreated : Pos 10, 1 Bit
+0x300 EmptyJobEvaluated : Pos 11, 1 Bit
+0x300 DefaultPagePriority : Pos 12, 3 Bits
+0x300 PrimaryTokenFrozen : Pos 15, 1 Bit
+0x300 ProcessVerifierTarget : Pos 16, 1 Bit
+0x300 RestrictSetThreadContext : Pos 17, 1 Bit
+0x300 AffinityPermanent : Pos 18, 1 Bit
+0x300 AffinityUpdateEnable : Pos 19, 1 Bit
+0x300 PropagateNode : Pos 20, 1 Bit
+0x300 ExplicitAffinity : Pos 21, 1 Bit
+0x300 ProcessExecutionState : Pos 22, 2 Bits
+0x300 EnableReadVmLogging : Pos 24, 1 Bit
+0x300 EnableWriteVmLogging : Pos 25, 1 Bit
+0x300 FatalAccessTerminationRequested : Pos 26, 1 Bit
EPROCESS is a kernel memory structure that describes system processes (or in other words – each process running on a system has its corresponding _EPROCESS object somewhere in the kernel) as we know them. It contains details such as process image name, which desktop session it is running in, how many open handles to other kernel objects it has, what access token it has and much more.
Though its difficult to describe all the fields but we can take a look at most commonly used ActiveProcessLinks : _LIST_ENTRY
To further drill down into _LIST_ENTRY lets dump its data structure
kd> dt _LIST_ENTRY
nt!_LIST_ENTRY
+0x000 Flink : Ptr64 _LIST_ENTRY
+0x008 Blink : Ptr64 _LIST_ENTRY
After seeing above we can say that LIST_ENTRY is the doubly-linked list equivalent data structure in Windows kernel where Flink is the forward link and Blink is the backward link
All Windows processes have their corresponding kernel objects in the form of an EPROCESS kernel structure. All those EPROCESS objects are stored in a doubly-linked list.
Effectively, this means that when a cmd /c tasklist or get-process is invoked to get a list of all running processes on the system, Windows walks through the doubly-linked list of EPROCESS nodes, utilizing the LIST_ENTRY structures and retrieves information about all currently active processes. Also, malware programs can manipulate it to hide in plain sight.
Lets see _LIST_ENTRY for a particular process:
kd> dt _eprocess ffffc2886a4b90c0
nt!_EPROCESS
+0x000 Pcb : _KPROCESS
+0x2d8 ProcessLock : _EX_PUSH_LOCK
+0x2e0 UniqueProcessId : 0x00000000`0000074c Void
+0x2e8 ActiveProcessLinks : _LIST_ENTRY [ 0xffffc288`65a6a5a8 - 0xffffc288`6a77e368 ]
+0x2f8 RundownProtect : _EX_RUNDOWN_REF
+0x300 Flags2 : 0x200d000
PEB
While EPROCESS and KPROCESS structures are accessible only from kernel mode, PEB lives in the user-mode address space of the process it describes. It contains information needed by the image loader, the heap manager, and other Windows components that need to access it from user mode
Lets take a quick look into PEB data structure :
kd> dt nt!_PEB
+0x000 InheritedAddressSpace : UChar
+0x001 ReadImageFileExecOptions : UChar
+0x002 BeingDebugged : UChar
+0x003 BitField : UChar
+0x003 ImageUsesLargePages : Pos 0, 1 Bit
+0x003 IsProtectedProcess : Pos 1, 1 Bit
+0x003 IsImageDynamicallyRelocated : Pos 2, 1 Bit
+0x003 SkipPatchingUser32Forwarders : Pos 3, 1 Bit
+0x003 IsPackagedProcess : Pos 4, 1 Bit
+0x003 IsAppContainer : Pos 5, 1 Bit
+0x003 IsProtectedProcessLight : Pos 6, 1 Bit
+0x003 IsLongPathAwareProcess : Pos 7, 1 Bit
+0x004 Padding0 : [4] UChar
+0x008 Mutant : Ptr64 Void
+0x010 ImageBaseAddress : Ptr64 Void
+0x018 Ldr : Ptr64 _PEB_LDR_DATA
+0x020 ProcessParameters : Ptr64 _RTL_USER_PROCESS_PARAMETERS
+0x028 SubSystemData : Ptr64 Void
+0x030 ProcessHeap : Ptr64 Void
+0x038 FastPebLock : Ptr64 _RTL_CRITICAL_SECTION
+0x040 AtlThunkSListPtr : Ptr64 _SLIST_HEADER
+0x048 IFEOKey : Ptr64 Void
+0x050 CrossProcessFlags : Uint4B
+0x050 ProcessInJob : Pos 0, 1 Bit
+0x050 ProcessInitializing : Pos 1, 1 Bit
+0x050 ProcessUsingVEH : Pos 2, 1 Bit
+0x050 ProcessUsingVCH : Pos 3, 1 Bit
+0x050 ProcessUsingFTH : Pos 4, 1 Bit
+0x050 ProcessPreviouslyThrottled : Pos 5, 1 Bit
+0x050 ProcessCurrentlyThrottled : Pos 6, 1 Bit
+0x050 ProcessImagesHotPatched : Pos 7, 1 Bit
+0x050 ReservedBits0 : Pos 8, 24 Bits
+0x054 Padding1 : [4] UChar
+0x058 KernelCallbackTable : Ptr64 Void
+0x058 UserSharedInfoPtr : Ptr64 Void
+0x060 SystemReserved : Uint4B
+0x064 AtlThunkSListPtr32 : Uint4B
+0x068 ApiSetMap : Ptr64 Void
+0x070 TlsExpansionCounter : Uint4B
+0x074 Padding2 : [4] UChar
+0x078 TlsBitmap : Ptr64 Void
+0x080 TlsBitmapBits : [2] Uint4B
+0x088 ReadOnlySharedMemoryBase : Ptr64 Void
+0x090 SharedData : Ptr64 Void
+0x098 ReadOnlyStaticServerData : Ptr64 Ptr64 Void
+0x0a0 AnsiCodePageData : Ptr64 Void
To print information in more user friendly way use !peb
kd> !peb
PEB at 000000040a568000
InheritedAddressSpace: No
ReadImageFileExecOptions: No
BeingDebugged: No
ImageBaseAddress: 00007ff759f10000
NtGlobalFlag: 0
NtGlobalFlag2: 0
Ldr 00007ffc10ba53c0
Ldr.Initialized: Yes
Ldr.InInitializationOrderModuleList: 00000111c4b02430 . 00000111c4b11ba0
Ldr.InLoadOrderModuleList: 00000111c4b025a0 . 00000111c4b11b80
Ldr.InMemoryOrderModuleList: 00000111c4b025b0 . 00000111c4b11b90
Base TimeStamp Module
7ff759f10000 9c7fc54a Mar 15 03:41:14 2053 C:\Windows\system32\cmd.exe
7ffc10a40000 ed90036f Apr 19 03:44:15 2096 C:\Windows\SYSTEM32\ntdll.dll
7ffc0ff90000 250a0626 Sep 10 08:58:46 1989 C:\Windows\System32\KERNEL32.DLL
7ffc0d510000 7416f3ae Sep 20 11:00:30 2031 C:\Windows\System32\KERNELBASE.dll
7ffc0e0c0000 f362c2f9 May 24 21:58:49 2099 C:\Windows\System32\msvcrt.dll
7ffc0e2b0000 c366780e Nov 19 00:15:26 2073 C:\Windows\System32\combase.dll
7ffc0d410000 15f8b9b3 Sep 06 13:00:03 1981 C:\Windows\System32\ucrtbase.dll
7ffc0fb50000 f6dc9fc2 Mar 30 21:25:54 2101 C:\Windows\System32\RPCRT4.dll
7ffc0cc10000 94fbdec9 Mar 16 20:08:57 2049 C:\Windows\System32\bcryptPrimitives.dll
7ffc05140000 86e5a59a Sep 19 11:51:22 2041 C:\Windows\SYSTEM32\winbrand.dll
SubSystemData: 0000000000000000
ProcessHeap: 00000111c4b00000
ProcessParameters: 00000111c4b01b60
CurrentDirectory: 'C:\Users\Administrator\'
WindowTitle: 'C:\Users\Administrator\AppData\Roaming\Microsoft\Windows\Start Menu\Programs\System Tools\Command Prompt.lnk'
ImageFile: 'C:\Windows\system32\cmd.exe'
CommandLine: '"C:\Windows\system32\cmd.exe" '
DllPath: '< Name not readable >'
Environment: 00000111c4b133d0
=::=::\
=C:=C:\Users\Administrator
ALLUSERSPROFILE=C:\ProgramData
APPDATA=C:\Users\Administrator\AppData\Roaming
CommonProgramFiles=C:\Program Files\Common Files
CommonProgramFiles(x86)=C:\Program Files (x86)\Common Files
CommonProgramW6432=C:\Program Files\Common Files
COMPUTERNAME=WIN-RSJ9BBE9FMC
ComSpec=C:\Windows\system32\cmd.exe
DriverData=C:\Windows\System32\Drivers\DriverData
HOMEDRIVE=C:
HOMEPATH=\Users\Administrator
LOCALAPPDATA=C:\Users\Administrator\AppData\Local
LOGONSERVER=\\WIN-RSJ9BBE9FMC
NUMBER_OF_PROCESSORS=1
OS=Windows_NT
Path=C:\Windows\system32;C:\Windows;C:\Windows\System32\Wbem;C:\Windows\System32\WindowsPowerShell\v1.0\;C:\Windows\System32\OpenSSH\;C:\Users\Administrator\AppData\Local\Microsoft\WindowsApps;
PATHEXT=.COM;.EXE;.BAT;.CMD;.VBS;.VBE;.JS;.JSE;.WSF;.WSH;.MSC
PROCESSOR_ARCHITECTURE=AMD64
PROCESSOR_IDENTIFIER=Intel64 Family 6 Model 78 Stepping 3, GenuineIntel
PROCESSOR_LEVEL=6
PROCESSOR_REVISION=4e03
ProgramData=C:\ProgramData
ProgramFiles=C:\Program Files
ProgramFiles(x86)=C:\Program Files (x86)
ProgramW6432=C:\Program Files
PROMPT=$P$G
PSModulePath=C:\Program Files\WindowsPowerShell\Modules;C:\Windows\system32\WindowsPowerShell\v1.0\Modules
PUBLIC=C:\Users\Public
SESSIONNAME=Console
SystemDrive=C:
SystemRoot=C:\Windows
TEMP=C:\Users\ADMINI~1\AppData\Local\Temp\1
TMP=C:\Users\ADMINI~1\AppData\Local\Temp\1
USERDOMAIN=WIN-RSJ9BBE9FMC
USERDOMAIN_ROAMINGPROFILE=WIN-RSJ9BBE9FMC
USERNAME=Administrator
USERPROFILE=C:\Users\Administrator
windir=C:\Windows
Threads
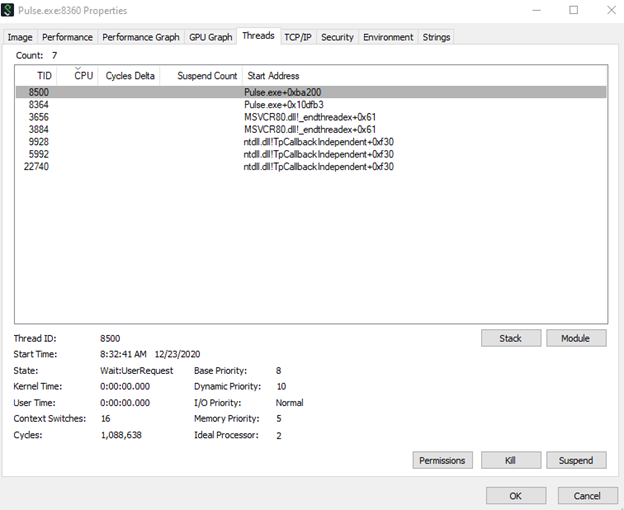
To take a closer look at the threads lets open process exploere and select a process by double clicking on it


In the above snapshot you can see the kernel Time and User time taken up by the thread. This is important in finding out which threads are causing high CPU
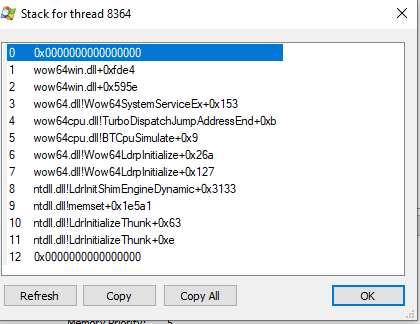
In the threads tab we can see all the threads that are forked. To look at call stack double click on the thread

To see threads for a process, switch to the process context and then type k
kd> k
# Child-SP RetAddr Call Site
00 fffff801`4ba72b78 fffff801`498474cc nt!DbgBreakPointWithStatus
01 fffff801`4ba72b80 fffff801`498437e6 nt!KdCheckForDebugBreak+0xeff24
02 fffff801`4ba72bb0 fffff801`496fbdc4 nt!KeAccumulateTicks+0x1448e6
*** Unable to resolve unqualified symbol in Bp expression 'CreateProcess'.
*** Unable to resolve unqualified symbol in Bp expression 'CreateProcess'.
*** Unable to resolve unqualified symbol in Bp expression 'CreateProcessAsUser'.
03 fffff801`4ba72c10 fffff801`4a089332 nt!KeClockInterruptNotify+0x604
04 fffff801`4ba72f30 00000000`00000000 0xfffff801`4a089332
For further drilling down you can click on the number hyperlink to see the stack.
Reference
- Windows Internal
- https://apprize.best/microsoft/internals/5.html
