

After analyzing multiple dump files via Windbg, the next logical step was to start with Forensic Memory Analysis. After going through lots of youtube videos I decided to use Volatility — A memory forensics analysis platform to being my journey into Memory analysis.
Why Volatility
- It is written in python and python is my go to scripting language for some years now
- Open source
- Support for Windows, Linux and Mac
- Easy to start after seeing basic documentation, I downloaded sample dump file and started practicing
How to Install
Expectation:
After going through multiple sites, I was expecting to download source code from git, compile it , then use pip to install multiple packages and then pray that all this will not ruin your existing setup
Reality
Go to the website https://www.volatilityfoundation.org/releases and download the executable file. Yes, that’s it you are ready to start you Memory Forensic journey
Next download dumps from the opensource volatility dumps platform and start practicing . You can download dumps from here. For our first post we are going to start with Cridex Malware
Cridex Malware
The first command we will execute imageinfo. This command will do a basic analysis of the dump file and will suggest OS image which we will use as profile
C:\Users\Administrator\Desktop\volatility_2.6_win64_standalone>
volatility_2.6_win64_standalone.exe -f cridex.vmem imageinfo
After running the command we will get below output :
Volatility Foundation Volatility Framework 2.6
INFO : volatility.debug : Determining profile based on KDBG search…
 Suggested Profile(s) : WinXPSP2x86, WinXPSP3x86 (Instantiated with WinXPSP2x86)
 AS Layer1 : IA32PagedMemoryPae (Kernel AS)
 AS Layer2 : FileAddressSpace (C:\Users\Administrator\Desktop\volatility_2.6_win64_standalone\cridex.vmem)
 PAE type : PAE
 DTB : 0x2fe000L
 KDBG : 0x80545ae0L
 Number of Processors : 1
 Image Type (Service Pack) : 3
 KPCR for CPU 0 : 0xffdff000L
 KUSER_SHARED_DATA : 0xffdf0000L
 Image date and time : 2012–07–22 02:45:08 UTC+0000
 Image local date and time : 2012–07–21 22:45:08 -0400
From above output we can confirm OS profile is WinXPSP2x86.
Next we will check what processes were running on the infected system. To do so we will use pslist plugin
C:\Users\Administrator\Desktop\volatility_2.6_win64_standalone>
volatility_2.6_win64_standalone.exe -f cridex.vmem — profile=WinXPSP3x86 pslist
Volatility Foundation Volatility Framework 2.6
Offset(V) Name PID PPID Thds Hnds Sess Wow64 Start Exit
 — — — — — — — — — — — — — — — — — — — — — — — — — — — — — — — — — — — — — — — — — — — — — — — — — — — — — — — — — — — — — — — —
0x823c89c8 System 4 0 53 240 — — — 0
0x822f1020 smss.exe 368 4 3 19 — — — 0 2012–07–22 02:42:31 UTC+0000
0x822a0598 csrss.exe 584 368 9 326 0 0 2012–07–22 02:42:32 UTC+0000
0x82298700 winlogon.exe 608 368 23 519 0 0 2012–07–22 02:42:32 UTC+0000
0x81e2ab28 services.exe 652 608 16 243 0 0 2012–07–22 02:42:32 UTC+0000
0x81e2a3b8 lsass.exe 664 608 24 330 0 0 2012–07–22 02:42:32 UTC+0000
0x82311360 svchost.exe 824 652 20 194 0 0 2012–07–22 02:42:33 UTC+0000
0x81e29ab8 svchost.exe 908 652 9 226 0 0 2012–07–22 02:42:33 UTC+0000
0x823001d0 svchost.exe 1004 652 64 1118 0 0 2012–07–22 02:42:33 UTC+0000
0x821dfda0 svchost.exe 1056 652 5 60 0 0 2012–07–22 02:42:33 UTC+0000
0x82295650 svchost.exe 1220 652 15 197 0 0 2012–07–22 02:42:35 UTC+0000
0x821dea70 explorer.exe 1484 1464 17 415 0 0 2012–07–22 02:42:36 UTC+0000
0x81eb17b8 spoolsv.exe 1512 652 14 113 0 0 2012–07–22 02:42:36 UTC+0000
0x81e7bda0 reader_sl.exe 1640 1484 5 39 0 0 2012–07–22 02:42:36 UTC+0000
0x820e8da0 alg.exe 788 652 7 104 0 0 2012–07–22 02:43:01 UTC+0000
0x821fcda0 wuauclt.exe 1136 1004 8 173 0 0 2012–07–22 02:43:46 UTC+0000
0x8205bda0 wuauclt.exe 1588 1004 5 132 0 0 2012–07–22 02:44:01 UTC+0000
Next we will use pstree plugin to print process hierarchy
C:\Users\Administrator\Desktop\volatility_2.6_win64_standalone>volatility_2.6_win64_standalone.exe -f cridex.vmem — profile=WinXPSP3x86 pstree
Volatility Foundation Volatility Framework 2.6
Name Pid PPid Thds Hnds Time
 — — — — — — — — — — — — — — — — — — — — — — — — — — — — — — — — — — — — — — —
 0x823c89c8:System 4 0 53 240 1970–01–01 00:00:00 UTC+0000
. 0x822f1020:smss.exe 368 4 3 19 2012–07–22 02:42:31 UTC+0000
.. 0x82298700:winlogon.exe 608 368 23 519 2012–07–22 02:42:32 UTC+0000
… 0x81e2ab28:services.exe 652 608 16 243 2012–07–22 02:42:32 UTC+0000
…. 0x821dfda0:svchost.exe 1056 652 5 60 2012–07–22 02:42:33 UTC+0000
…. 0x81eb17b8:spoolsv.exe 1512 652 14 113 2012–07–22 02:42:36 UTC+0000
…. 0x81e29ab8:svchost.exe 908 652 9 226 2012–07–22 02:42:33 UTC+0000
…. 0x823001d0:svchost.exe 1004 652 64 1118 2012–07–22 02:42:33 UTC+0000
….. 0x8205bda0:wuauclt.exe 1588 1004 5 132 2012–07–22 02:44:01 UTC+0000
….. 0x821fcda0:wuauclt.exe 1136 1004 8 173 2012–07–22 02:43:46 UTC+0000
…. 0x82311360:svchost.exe 824 652 20 194 2012–07–22 02:42:33 UTC+0000
…. 0x820e8da0:alg.exe 788 652 7 104 2012–07–22 02:43:01 UTC+0000
…. 0x82295650:svchost.exe 1220 652 15 197 2012–07–22 02:42:35 UTC+0000
… 0x81e2a3b8:lsass.exe 664 608 24 330 2012–07–22 02:42:32 UTC+0000
.. 0x822a0598:csrss.exe 584 368 9 326 2012–07–22 02:42:32 UTC+0000
 0x821dea70:explorer.exe 1484 1464 17 415 2012–07–22 02:42:36 UTC+0000
. 0x81e7bda0:reader_sl.exe 1640 1484 5 39 2012–07–22 02:42:36 UTC+0000
One process that immediately stands out is reader_sl.exe with pid 1640 and parent id 1484 which is explorer.exe. Though as of now we can not attribute any thing fishy here.
Next we will use psxview to find any hidden processes
C:\Users\Administrator\Desktop\volatility_2.6_win64_standalone>
volatility_2.6_win64_standalone.exe -f cridex.vmem --profile=WinXPSP3x86 psxview
Volatility Foundation Volatility Framework 2.6
Offset(P)  Name                    PID pslist psscan thrdproc pspcid csrss session deskthrd ExitTime
---------- -------------------- ------ ------ ------ -------- ------ ----- ------- -------- --------
0x02498700 winlogon.exe            608 True   True   True     True
0x02511360 svchost.exe             824 True   True   True     True
0x022e8da0 alg.exe                 788 True   True   True     True
0x020b17b8 spoolsv.exe            1512 True   True   True     True
0x0202ab28 services.exe            652 True   True   True     True
0x02495650 svchost.exe
0x0207bda0 reader_sl.exe          1640 True   True   True     True
0x025001d0 svchost.exe            1004 True   True   True     True   0x02029ab8 svchost.exe             908 True   True   True     True
0x023fcda0 wuauclt.exe            1136 True   True   True     True
0x0225bda0 wuauclt.exe            1588 True   True   True     True
0x0202a3b8 lsass.exe               664 True   True   True     True
0x023dea70 explorer.exe           1484 True   True   True     True
0x023dfda0 svchost.exe            1056 True   True   True     True
0x024f1020 smss.exe                368 True   True   True     True
0x025c89c8 System                    4 True   True   True     True
0x024a0598 csrss.exe               584 True   True   True     True
As we can see there are no hidden processes in this case.
So next we will check for any tcp connections and open sockets. For this we will execute conscans and sockets plugin respectively
C:\Users\Administrator\Desktop\volatility_2.6_win64_standalone>volatility_2.6_win64_standalone.exe -f cridex.vmem — profile=WinXPSP3x86 connscan
Volatility Foundation Volatility Framework 2.6
Offset(P) Local Address Remote Address             Pid
 — — — — — — — — — — — — — — — — — — — — — — — — — — — — — — — — -
0x02087620 172.16.112.128:1038 41.168.5.140:8080     1484
0x023a8008 172.16.112.128:1037 125.19.103.198:8080   1484
We can see 2 tcp connections from 172.16.112.128 to 41.168.5.140 and 125.19.103.198 were used by process 1484, i.e. explorer.exe
After executing sockets we can see that 1 of the tcp connections opened from explorer.exe is still open
C:\Users\Administrator\Desktop\volatility_2.6_win64_standalone>volatility_2.6_win64_standalone.exe -f cridex.vmem — profile=WinXPSP3x86 sockets
Volatility Foundation Volatility Framework 2.6

Offset(V)       PID   Port  Proto Protocol        Address         Create Time
---------- -------- ------ ------ --------------- --------------- -----------
0x81ddb780      664    500     17 UDP             0.0.0.0
0x82240d08     1484   1038      6 TCP             0.0.0.0
0x81dd7618     1220   1900     17 UDP             172.16.112.128
0x82125610      788   1028      6 TCP             127.0.0.1
0x8219cc08        4    445      6 TCP             0.0.0.0
0x81ec23b0      908    135      6 TCP             0.0.0.0
0x82276878        4    139      6 TCP             172.16.112.128
0x82277460        4    137     17 UDP             172.16.112.128
0x81e76620     1004    123     17 UDP             127.0.0.1
0x82172808      664      0    255 Reserved        0.0.0.0
0x81e3f460        4    138     17 UDP             172.16.112.128
0x821f0630     1004    123     17 UDP             172.16.112.128
0x822cd2b0     1220   1900     17 UDP             127.0.0.1
0x82172c50      664   4500     17 UDP             0.0.0.0
0x821f0d00        4    445     17 UDP             0.0.0.0
Next we will check the last commands that were executed on the infected system. For this we will use cmdline, cmdscan and consoles plugin
C:\Users\Administrator\Desktop\volatility_2.6_win64_standalone>
volatility_2.6_win64_standalone.exe -f cridex.vmem — profile=WinXPSP3x86 cmdline
Volatility Foundation Volatility Framework 2.6
************************************************************************
System pid: 4
************************************************************************
smss.exe pid: 368
Command line : \SystemRoot\System32\smss.exe
************************************************************************
csrss.exe pid: 584
Command line : C:\WINDOWS\system32\csrss.exe ObjectDirectory=\Windows SharedSection=1024,3072,512 Windows=On SubSystemType=Windows ServerDll=basesrv,1 ServerDll=winsrv:UserServerDllInitialization,3 ServerDll=winsrv:ConServerDllInitialization,2 ProfileControl=Off MaxRequestThreads=16
************************************************************************
winlogon.exe pid: 608
Command line : winlogon.exe
************************************************************************
services.exe pid: 652
Command line : C:\WINDOWS\system32\services.exe
************************************************************************
lsass.exe pid: 664
Command line : C:\WINDOWS\system32\lsass.exe
************************************************************************
svchost.exe pid: 824
Command line : C:\WINDOWS\system32\svchost -k DcomLaunch
************************************************************************
svchost.exe pid: 908
Command line : C:\WINDOWS\system32\svchost -k rpcss
************************************************************************
svchost.exe pid: 1004
Command line : C:\WINDOWS\System32\svchost.exe -k netsvcs
************************************************************************
svchost.exe pid: 1056
Command line : C:\WINDOWS\system32\svchost.exe -k NetworkService
************************************************************************
svchost.exe pid: 1220
Command line : C:\WINDOWS\system32\svchost.exe -k LocalService
************************************************************************
explorer.exe pid: 1484
Command line : C:\WINDOWS\Explorer.EXE
************************************************************************
spoolsv.exe pid: 1512
Command line : C:\WINDOWS\system32\spoolsv.exe
************************************************************************
reader_sl.exe pid: 1640
Command line : “C:\Program Files\Adobe\Reader 9.0\Reader\Reader_sl.exe”
************************************************************************
alg.exe pid: 788
Command line : C:\WINDOWS\System32\alg.exe
************************************************************************
wuauclt.exe pid: 1136
Command line : “C:\WINDOWS\system32\wuauclt.exe” /RunStoreAsComServer Local\[3ec]SUSDSb81eb56fa3105543beb3109274ef8ec1
************************************************************************
wuauclt.exe pid: 1588
Command line : “C:\WINDOWS\system32\wuauclt.exe”
Before moving ahead lets sum up the investigation we have done till now :
- Explorer.exe is the parent process of Reader_sl.exe which on surface appears to be related to Adobe Reader
- we have 2 open tcp connections from above process to 2 different external IP which is a bit suspicious
Based on above observations we will take a closer look at the Reader_sl.exe process.
The first thing we will do is dump the memory contents of Reader_sl.exe. into a separate file by executing below command. In the below command -p switch takes the process id of the target process and dump-dir is the directory where dump file will be saved.
C:\Users\Administrator\Desktop\volatility_2.6_win64_standalone>
volatility_2.6_win64_standalone.exe -f cridex.vmem — profile=WinXPSP3x86 memdump -p 1640 — dump-dir .
Volatility Foundation Volatility Framework 2.6
************************************************************************
Writing reader_sl.exe [ 1640] to 1640.dmp
Lets take a look at dmp file. To do so open it in Notepad.exe and search for 41.168.5.140. The idea to search for came from the output of conscans (41.168.5.140:8080) .
Bingo, we can see below in the file and can conclude that Reader_sl.exe is sending data from user to 41.168.5.140 via http post
Accept: */*
User-Agent: Mozilla/5.0 (Windows; U; MSIE 7.0; Windows NT 6.0; en-US)
PVñ¿ )Gz¡ E û ]@ €Û¬p€)¨Œºe]þpÀPDpI8 POST /zb/v_01_a/in/ HTTP/1.1
Host: 41.168.5.140:8080
Content-Length: 229
Connection: Keep-Alive
Cache-Control: no-cache
Next search for port 8080 in the file and we can see we can see http://188.40.0.138:8080/zb/v_01_a/in/cp.php and also number of banking domains around it.
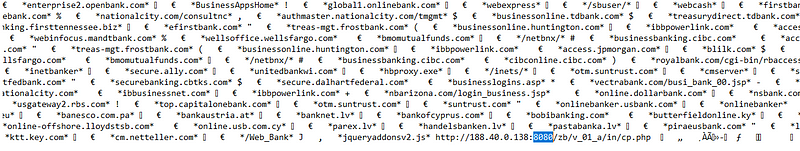
On further scrolling can see a complete web application with card payment gateway and functionalities.
With above information we can conclude that the system is infected y a trojan.
Also we can use VirusTotal.com and other similar sites for further investigation. To do so lets use procdump to creat .exe file
C:\Users\Administrator\Desktop\volatility_2.6_win64_standalone>
volatility_2.6_win64_standalone.exe -f cridex.vmem — profile=WinXPSP3x86 procdump -p 1640 — dump-dir C:\
Volatility Foundation Volatility Framework 2.6
Process(V) ImageBase Name Result
 — — — — — — — — — — — — — — — — — — — — — — —
0x81e7bda0 0x00400000 reader_sl.exe OK: executable.1640.exe
As soon as .exe file was generated , windows immediately quarantined the file claiming it to be a Trojan, thus confirming our investigation.
Prevention
Lets say if this incident happened in an enterprise environment. As a Forensic investigator, though we have isolated the exe and managed to identify the trojan . However we don’t know how many more systems are infected . To do so we need to send the (Indicators of Compromise) that we have isolated so far to the security team. Lets see what are the indicators so far:
- 41.168.5.140:8080
- http://188.40.0.138:8080/zb/v_01_a/in/cp.php
Next we should instruct the security team to drop all traffic that is going towards above ips, document the IPs from which traffic was generated and isolate those machines.
3. Reach out to Anti-Virus vendor with infected .exe and based on the output update AV on all systems
References
One Response